This family of functions revolves around grouping overlapping intervals
within a single iv. When multiple overlapping intervals are grouped together
they result in a wider interval containing the smallest iv_start() and the
largest iv_end() of the overlaps.
iv_groups()merges all overlapping intervals found withinx. The resulting intervals are known as the "groups" ofx.iv_identify_group()identifies the group that the current interval ofxfalls in. This is particularly useful alongsidedplyr::group_by().iv_locate_groups()returns a two column data frame with akeycolumn containing the result ofiv_groups()and aloclist-column containing integer vectors that map each interval inxto the group that it falls in.
Optionally, you can choose not to group abutting intervals together with
abutting = FALSE, which can be useful if you'd like to retain those
boundaries.
Minimal interval vectors
iv_groups() is particularly useful because it can generate a minimal
interval vector, which covers the range of an interval vector in the most
compact form possible. In particular, a minimal interval vector:
Has no overlapping intervals
Has no abutting intervals
Is ordered on both
startandend
A minimal interval vector is allowed to have a single missing interval, which is located at the end of the vector.
Usage
iv_groups(x, ..., abutting = TRUE)

iv_identify_group(x, ..., abutting = TRUE)

iv_locate_groups(x, ..., abutting = TRUE)
Arguments
- x
[iv]An interval vector.
- ...
These dots are for future extensions and must be empty.
- abutting
[TRUE / FALSE]Should abutting intervals be grouped together?
If
TRUE,[a, b)and[b, c)will merge as[a, c). IfFALSE, they will be kept separate. To be a minimal interval vector, all abutting intervals must be grouped together.
Value
For
iv_groups(), an iv with the same type asx.For
iv_identify_group(), an iv with the same type and size asx.For
iv_locate_groups(), a two column data frame with akeycolumn containing the result ofiv_groups()and aloclist-column containing integer vectors.
Graphical Representation
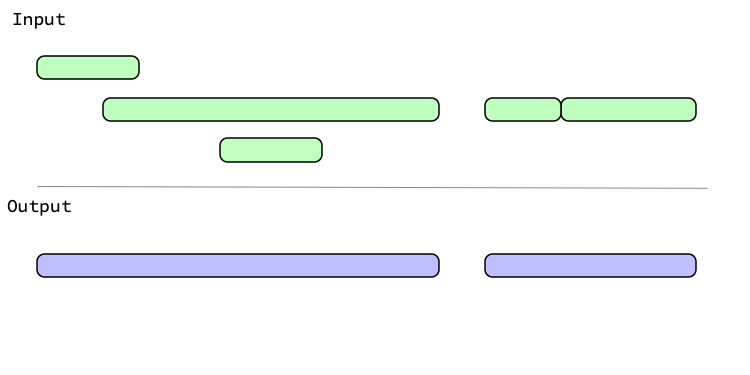
Graphically, generating groups looks like:

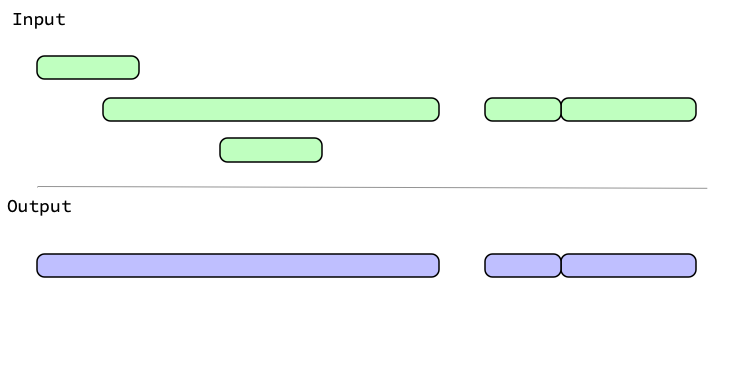
With abutting = FALSE, intervals that touch aren't grouped:

Examples
library(dplyr, warn.conflicts = FALSE)

x <- iv_pairs(
  c(1, 5),
  c(2, 3),
  c(NA, NA),
  c(5, 6),
  c(NA, NA),
  c(9, 12),
  c(11, 14)
)
x
#> <iv<double>[7]>
#> [1] [1, 5)   [2, 3)   [NA, NA) [5, 6)   [NA, NA) [9, 12)  [11, 14)

# Grouping removes all redundancy while still covering the full range
# of values that were originally represented. If any missing intervals
# are present, a single one is retained.
iv_groups(x)
#> <iv<double>[3]>
#> [1] [1, 6)   [9, 14)  [NA, NA)

# Abutting intervals are typically grouped together, but you can choose not
# to group them if you want to retain those boundaries
iv_groups(x, abutting = FALSE)
#> <iv<double>[4]>
#> [1] [1, 5)   [5, 6)   [9, 14)  [NA, NA)

# `iv_identify_group()` is useful alongside `group_by()` and `summarize()`
df <- tibble(x = x)
df <- mutate(df, u = iv_identify_group(x))
df
#> # A tibble: 7 × 2
#>           x         u
#>   <iv<dbl>> <iv<dbl>>
#> 1    [1, 5)    [1, 6)
#> 2    [2, 3)    [1, 6)
#> 3  [NA, NA)  [NA, NA)
#> 4    [5, 6)    [1, 6)
#> 5  [NA, NA)  [NA, NA)
#> 6   [9, 12)   [9, 14)
#> 7  [11, 14)   [9, 14)

df %>%
  group_by(u) %>%
  summarize(n = n())
#> # A tibble: 3 × 2
#>           u     n
#>   <iv<dbl>> <int>
#> 1    [1, 6)     3
#> 2   [9, 14)     2
#> 3  [NA, NA)     2

# The real workhorse here is `iv_locate_groups()`, which returns
# the groups and information on which observations in `x` fall in which
# group
iv_locate_groups(x)
#>        key     loc
#> 1   [1, 6) 1, 2, 4
#> 2  [9, 14)    6, 7
#> 3 [NA, NA)    3, 5